
JD Elasticsearch uses ChubaoFS to realize the separation of computing and storage
Elasticsearch is an open source distributed RESTful search engine. As a distributed, scalable, real-time search and data analysis engine, it can quickly store, search and analyze large amounts of data. At the same time, Elasticsearch also supports the base engine with applications responsible for search functions and requirements, so it can be used in many different scenarios.
Usage scenarios of Elasticsearch in JinDong
Due to its high performance and low usage threshold, Elasticsearch is used in many scenarios within JD.
In June 2015, JD started to develop the Elasticsearch hosting platform - JElasticsearch. Jess Platform is mainly responsible for the daily maintenance of Elasticsearch cluster deployment, operation monitoring, data migration, authority management, plug-in development, and cluster upgrade.
At present, the clusters managed by the JES platform cover multiple business lines of JD, and also cover many application scenarios:
Complementary structured data query of relational database
The main application business is large-scale data query such as commodities, promotions, coupons, orders, cash registers, logistics, reconciliation, and reviews. The core requirements of this scenario are high performance, stability, and high availability. Some scenarios have retrieval requirements, which are usually used to accelerate relational databases. Business systems complete data synchronization through binlog synchronization or business double-writing.
Full text search function
The main application scenarios are application, security, risk control, transaction and other operation logs, as well as the search of some categories of goods on JD. This type of logging scenario has high requirements for writing, and relatively low requirements for query performance and high availability. Large business writes can reach tens of millions per second, and storage is calculated in units of PB.
These scenarios have relatively high requirements for disk and memory. Therefore, JD has also made corresponding optimizations to reduce memory consumption, improve the overall disk usage rate, use cheaper disks to reduce costs, and so on.
Real-time data analysis engine to form statistical reports
The main application business is various analysis of logistics orders, order data analysis, user portraits, etc. Because business data analysis has many latitudes, streaming analysis such as flink and storm is not suitable for some reporting scenarios, and real-time batch processing has become a problem. Therefore, Elasticsearch for near real-time analysis has become the choice of these businesses. 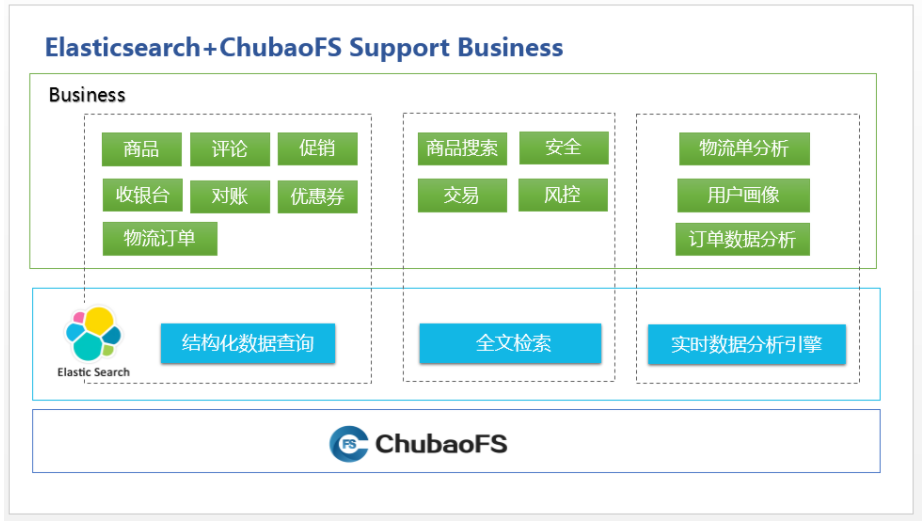
During the 5 years of applying Elasticsearch, JD has changed from the first few scenarios to cover various business lines, from the first few machines to the current order of thousands of machines and thousands of clusters, operation and maintenance And so did the pressure. At present, JD mainly faces the following problems in the daily operation and maintenance of the Elasticsearch cluster:
- IO reads and writes are uneven, and the IO pressure of some nodes is very high;
- The storage capacity of cold data nodes is limited by the maximum storage capacity of a single machine;
- The index node failure after close cannot be recovered, resulting in the risk of data loss.
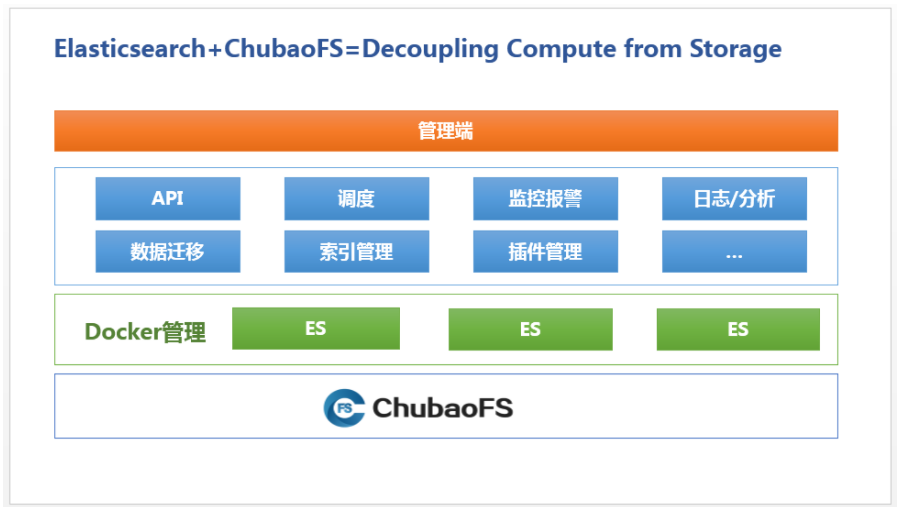
In order to solve these problems, JD.com applied ChubaoFS. ChubaoFS is a distributed file system developed by JD that provides high performance, high availability, scalability, and stability for cloud-native applications. It is used by the business side to help stateful applications realize the separation of computing and storage.
ChubaoFS supports multiple read-write models, supports multi-tenancy, and is compatible with POSIX semantics and S3 protocol. Each pod designed by ChubaoFS can share a storage volume, or each pod has a storage volume. When the physical machine where the container is located is down, the data of the container can be scheduled to other hosts along with the container to ensure reliable data storage .
The Evolution of Elasticsearch Instance Management
JD's Elasticsearch instance management is also a process of constant exploration and climbing.
Initial Phase
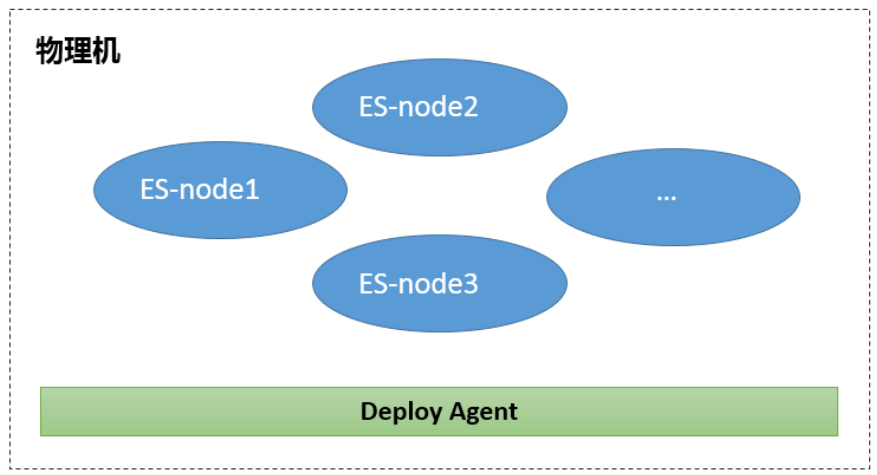
Initially, JD.com’s Elasticsearch cluster deployment had no architecture at all, and the cluster configuration also adopted the default configuration. One physical machine started multiple Elasticsearch processes, and the processes shared server resources completely. Different businesses were isolated using clusters. Forms use server CPU and memory are fully utilized.
After the system has been running for a period of time, the disadvantages of this deployment method begin to appear.
- Instances are easily affected by other nodes, and there is no effective way to avoid important business jitter problems.
- The memory of the physical machine is occupied by the cache, and it takes a long time to start a newly created instance.
- Instance storage is limited by the disk capacity of a single machine, and data migration occurs from time to time.
Container Isolation Phase
Since Elasticsearch is directly deployed on physical machines, CPU and memory cannot be managed, and each node affects each other significantly, and even affects stability. Therefore, in response to the above situation, JD.com has made an improvement plan-investigating resource isolation methods.
At that time, there were two mainstream resource isolation methods, Docker containerization and virtual machines.
In 2016, the Docker containerization technology has been formed, but the virtual technology is relatively mature with a large number of tools and a complete ecosystem. Compared with the resource isolation of virtual machines, Docker does not need to implement hardware virtualization, but only uses cgroups to limit resources, and actually uses the resources of physical machines, so it is more efficient in terms of resource utilization. We have tested that using Docker The resulting performance loss is relatively small and almost negligible.
Docker is limited by resources. It does not need to load the operating system kernel when starting, and it can be started in milliseconds. The resource consumption of startup is much lower, and it can be started and stopped quickly. In addition, because it is a resource limitation category, it only limits the maximum usage and does not isolate the minimum, so that virtualization can be used to overbuy resources and improve resource utilization.
In terms of the advantages of virtual machines, such as security, JD.com uses an internal resource sharing platform to make up for it through process management or other internal facilities. In this way, the original advantage of complete resource isolation has become a disadvantage of maximizing the use of internal system resources.
Therefore, JD.com chose the relatively immature containerized deployment method at that time, and implemented Elasticsearcht resource isolation on the server:
Memory isolation completely:
- Data/primary nodes: By default, jvm50% is used, half of which is reserved for Lucene as a cache.
- Gateway/master node: Memory capacity -2 as jvm memory, 2G reserved for monitoring and other services.
CPU isolation:
- Important services are directly bound to the CPU, completely avoiding resource preemption.
- For general business, CPU ratio allocation is performed by adjusting cpu-sharElasticsearch, cpu-period, and cpu-quota.
I/O isolation::
- Due to the diversity of machines in the production environment, the disk IO itself is very different. In addition, the restriction on IO will cause a serious decline in the read and write performance of Elasticsearch. For the sake of internal business only, JD.com does not isolate IO.
- With simple container isolation, CPU preemption is significantly improved. After the memory is completely isolated, the interaction between nodes in the production environment rarely occurs (machines with poor IO will have IO contention), and the transformation of the deployment method has generated application benefits.
Stateless Instance Phase
With the continuous growth of business, the number of clusters and the server resources consumed have increased proportionally. The number of JD Elasticsearch instances has increased to tens of thousands, and the number of maintained clusters has rapidly increased to thousands, with cluster sizes ranging from a few to dozens.
However, the overall resource utilization is relatively low, the disk usage is only about 28%, and the average daily read and write IO is 10-20M/s (log partition IO is 60-100M/s). The reason for resource waste is that the cluster scale is generally small. In order to ensure the IO requirements of read and write requests in emergencies, we generally allocate relatively surplus resources to the cluster, and the containers allocated by physical machines will also be controlled at a certain level. .
We make an assumption that if a large number of server IO can be shared, then the impact of a cluster burst request on IO can actually be ignored. Based on this assumption and the urgent need to improve disk usage, we considered introducing the company's internal deployment of ChubaoFS as storage, and separated Elasticsearch as a stateless instance for storage and computing.
Thanks to ChubaoFS is a general-purpose file system designed for large-scale container cluster mounting, we can access it at almost zero cost. We only need to install the corresponding client on the physical machine to use ChubaoFS as a local file system. After the integration, we made a series of comparisons on the performance of ChubaoFS.
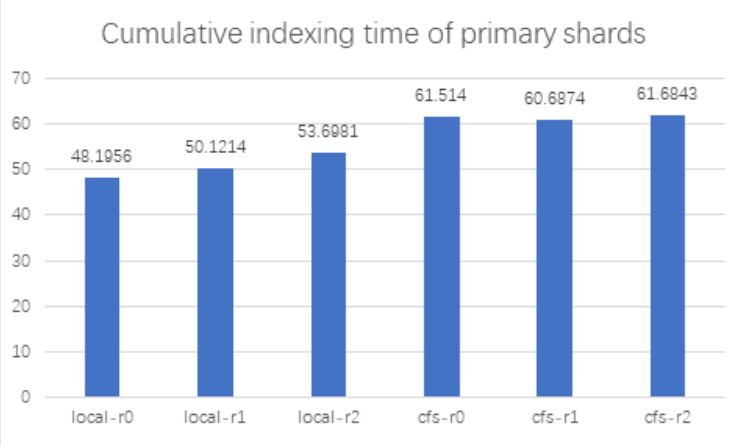
We use the elasticsearch benchmark testing tool Elasticsearchrally to conduct benchmark tests on Elasticsearch using local disks and ChubaoFS respectively. The test uses 7 elasticsearch nodes and 50 shards.
Elasticsearchrally test parameters are as follows:
Elasticsearchrally --pipeline=benchmark-only \--track=pmc \
--track-
params="number_of_replicas:${REPLICA_COUNT},number_of_shards:${SHARD_COUNT}" \--target-hosts=${TARGET_HOSTS}\--report-file=${report_file}
Among them, REPLICA_COUNT 0, 1, and 2 represent different replica numbers; SHARD_COUNT is 50.
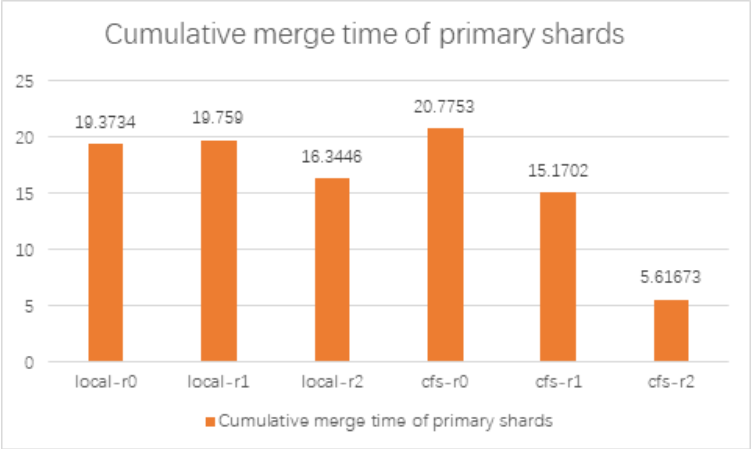
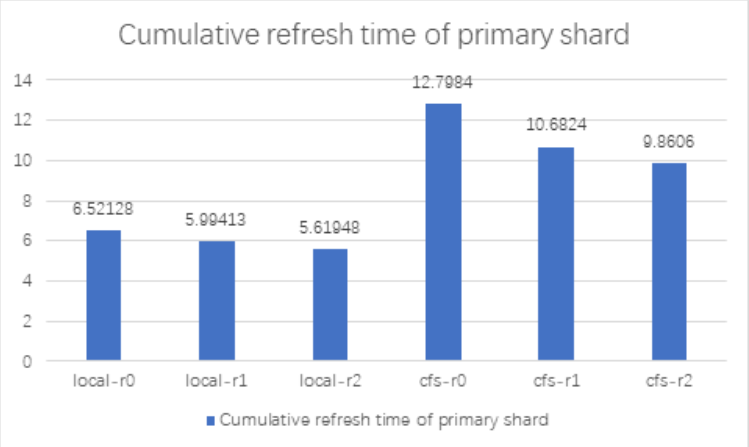
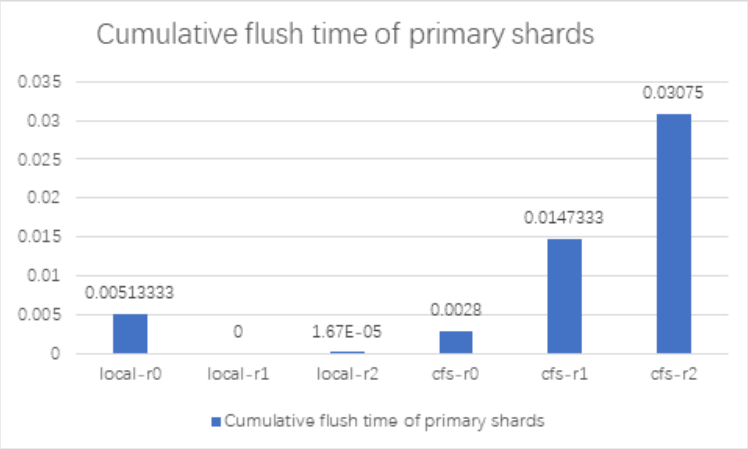
It can be seen from the test results that after Elasticsearch integrates ChubaoFS, the gap between the index benchmark performance and the local disk is about 110%~120% under different replica numbers, with only a slight decline; when the merge benchmark performance is replica > 0, the Elasticsearch Using ChubaoFS is better than local disk. refrElasticsearchh and flush benchmark performance ChubaoFS is not as good as local disk.
Current effect
After integrating ChubaoFS, we first ran it in grayscale for a period of time. After the effect was good, we switched all the bottom layers of all Elasticsearch clusters in JD Log to ChubaoFS. After the switch, we got better results in these areas:
Save Resources
Before adopting ChubaoFS, we used 500 physical machines, and about 80% of the disk IO capacity of each machine was usually idle. After adopting ChubaoFS, the cluster size of ChubaoFS is about 50, and Elasticsearch is hosted on the company's container platform to achieve elastic scalability.
Management and operation and maintenance are simpler and more convenient
After adopting ChubaoFS, we no longer have to worry about the hard disk failure of a certain machine, or the unbalanced read and write load of a certain machine.
GC frequency is significantly reduced
Since the bottom layer of ChubaoFS supports copying of files, Elasticsearch on the business layer sets the copy to 0. The original segment squeezed the heap memory and caused the FullGC phenomenon to be obvious. After connecting to ChubaoFS, the GC frequency is significantly reduced.