A Cloud Native Unstructured Data Storage
CubeFS is a new generation cloud-native open source storage system that supports access protocols such as S3, HDFS, and POSIX. It is widely applicable in various scenarios such as big data, AI/LLMs, container platforms, separation of storage and computing for databases and middleware, data sharing and protection,etc.
 Github
 The Key Features of CubeFS
Multi-Protocol
Compatible with various access protocols such as S3, POSIX, HDFS, etc., and the access between protocols can be interoperable
Multi-Engine
Support replicas and erasure coding engines, users can choose flexibly according to business scenarios
Highly Scalable
Easy to build a PB or EB-scale distributed storage service, and each module can be expanded horizontally
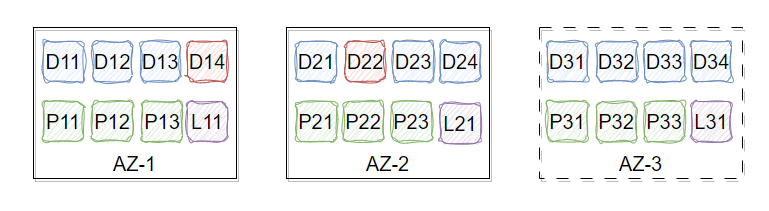
Multi-Tenancy
Supports multi-tenant management and provides fine-grained tenant isolation policies
High Performance
Supports multi-level caching, multiple high-performance replication protocols, and optimizes specific performance for small files
Cloud-Native
Easy to use CubeFS in Kubernetes via CSI Driver
CubeFS Deployment
CubeFS has developed a CSI plugin based on the Container Storage Interface (CSI) interface specification to support cloud storage in Kubernetes clusters.


CubeFS Application Scenarios
CubeFS is a cloud-native storage infrastructure that is widely used in a variety of scenarios, including big data storage, machine learning platforms, large-scale container platforms, as well as database and middleware storage and computing separation. It is also used for data sharing and protection.
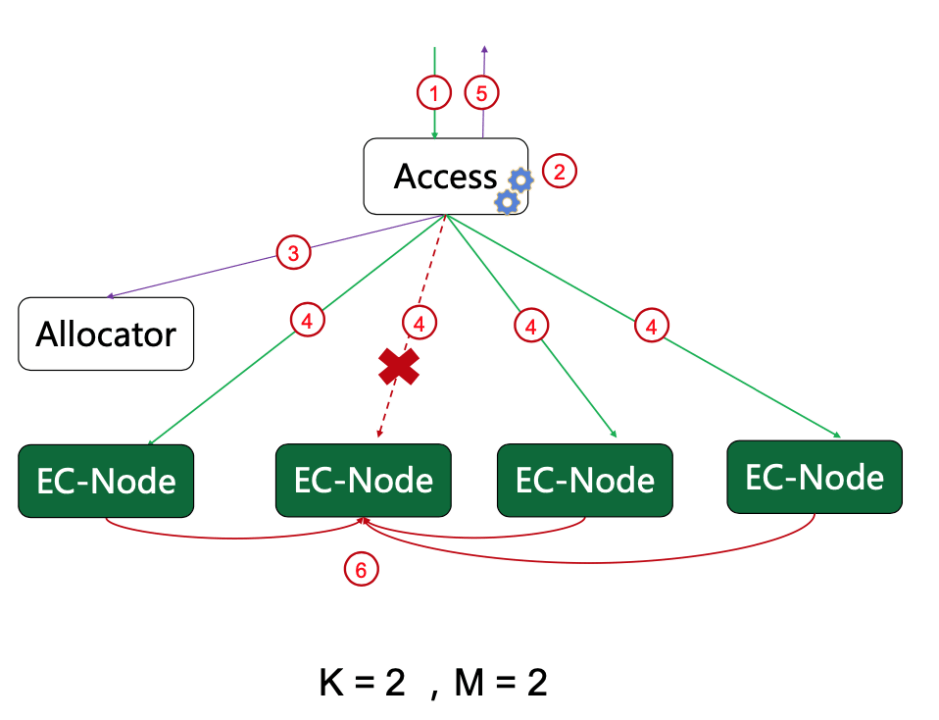
Building a Highly Reliable, Highly Available, Low-Cost, and EB-Scale Independent Key-Value Storage System with CubeFS.
As data continues to grow, businesses face greater cost challenges. In order to alleviate the storage cost pressure caused by multi-copy mode, CubeFS has introduced a erasure code subsystem (also known as BlobStore), which is a highly reliable, highly available, low-cost, and EB-scale independent key-value storage system.
Co-creating the Future with CubeFS: BIGO's Practice and Reflection
With the growth of the BIGO machine learning platform's models and data, more demands are placed on the underlying file system, such as multi-tenancy, high concurrency, high availability across multiple datacenters, high performance, and cloud-native features. CubeFS effectively meets these requirements, and BIGO is attempting to use CubeFS to address these challenges.
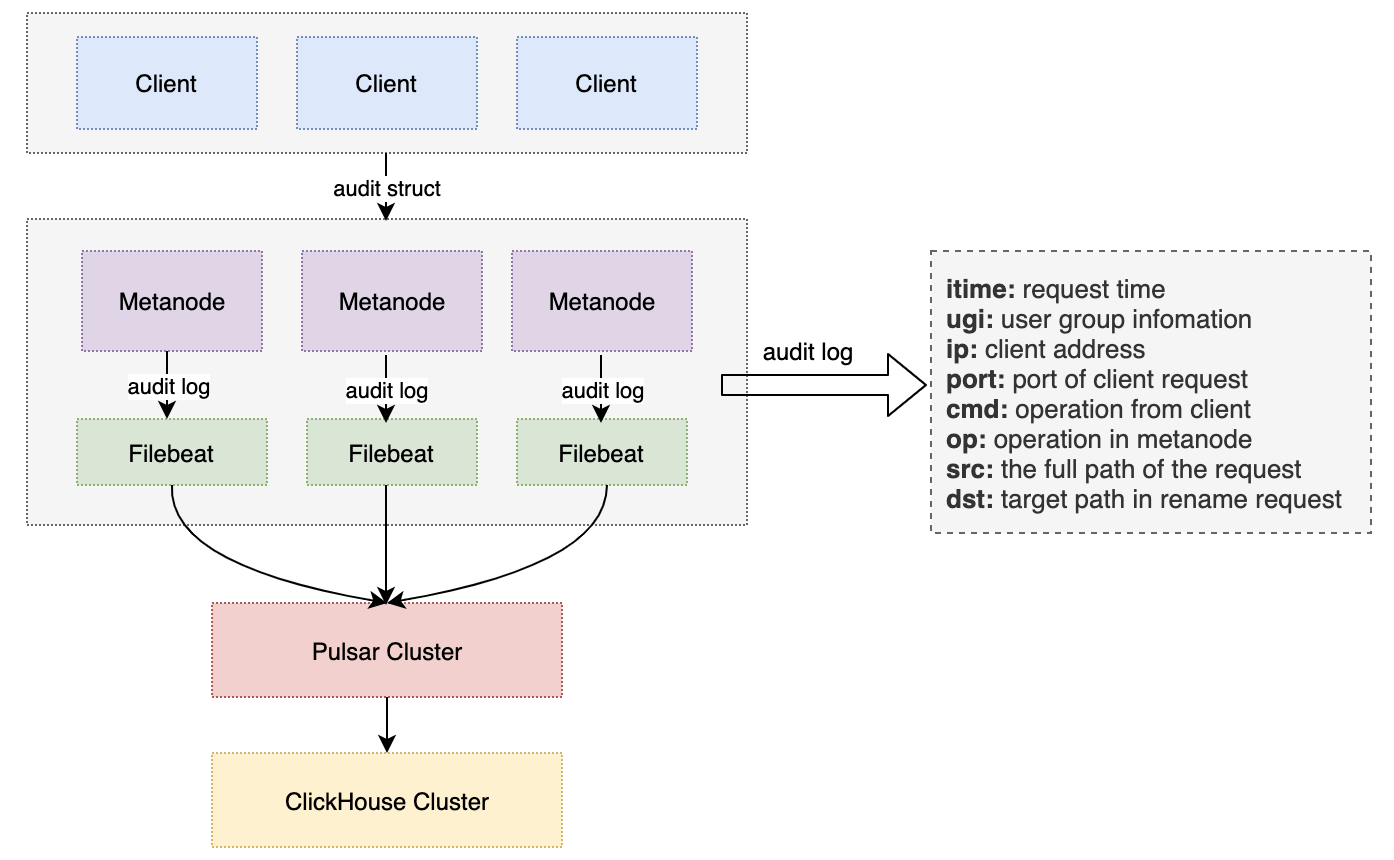
Data Lake Unified Storage Technology Practice
OPPO has been storing its large-scale data in HDFS clusters with a total storage capacity of EB-level. However, due to the rapidly growing business, the company faced several operational issues, including lack of machine resources, high operational costs, and high redundancy in storing cold and hot data. In order to solve these problems, OPPO implemented CubeFS
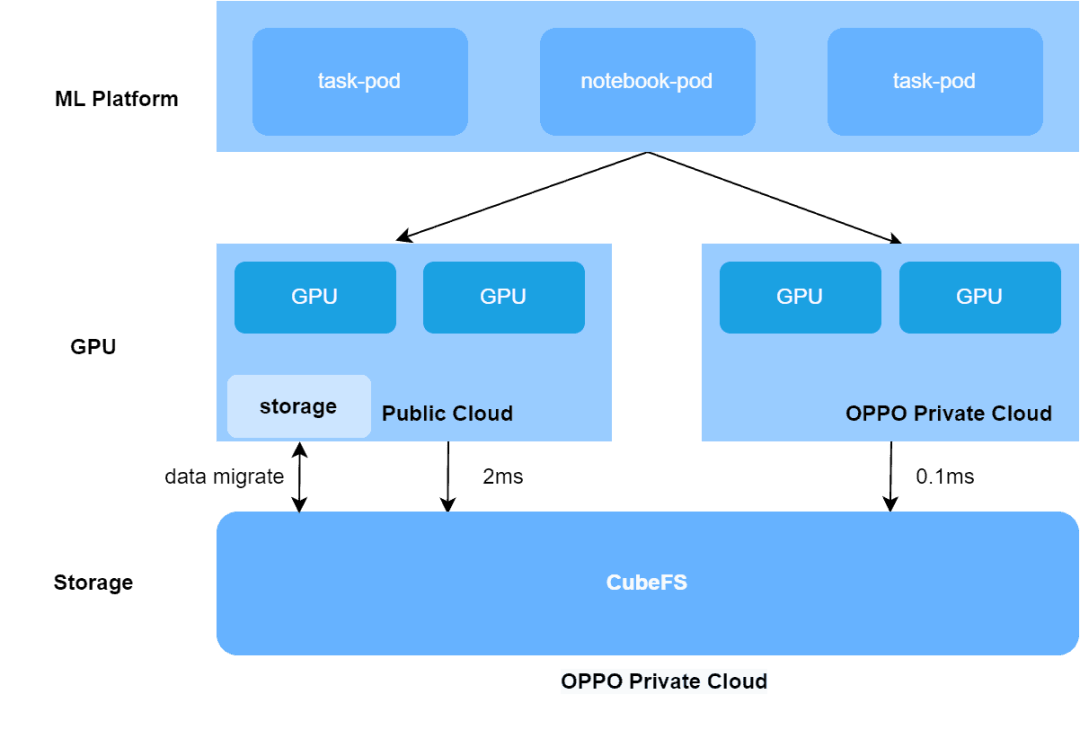
How CubeFS Accelerates AI training 3x in OPPO Hybrid Cloud platform
The article discusses OPPO's machine learning platform which supports over 100 AI businesses with tens of thousands of daily training tasks. In 2021, AI pioneers Oppo built a large-scale, end-to-end machine learning platform, leveraging CubeFS, to support AI training for more than 100 Oppo businesses – running tens of thousands of training tasks every day for business fields including voice assistant, commercial advertisement, OPPO game, ctag multi-mode, NLP and more.
Trusted by the Advanced Technology Enterprises
A young dynamic architecture firm, CubeFS provides peace of mind to any developer or homeowner dedicated to excellence.


Latest Blog
Contribute
There is a clear definition of roles and their promotion paths.

CubeFS is a Cloud Native Computing Foundation Incubating Project. For more details, please refer to SIGMOD 2019 paper .
Community
GitHub Discussions

Slack
Twitter / X